I am a big metal music fan, and as a lot of metal fans might know, metal musicians’ careers can span multiple bands, and some of the bigger stars will even come together to make a supergroup. I thought it would be fun to see how various bands are related, and luckily, Encyclopedia Metallum is a great source. (Metalheads tend to be quite into metal, and loyal.)
Traversal Method
My general method of approach was to start with one input band and collect a list of that band’s members, and for each of those members, iterate over any other band associated with that member.
One band page provides basic info like the band genre, the years active, origin, etc., along with a list of all members associated with a set of specific info. This info includes the instrument(s) they play/played (vocals in this case is listed as an instrument), the years associated with the instrument(s), and any other bands associated with this person. The associated bands list shows whether or not a band was before–denoted by an “ex-” prefix before the band’s name, e.g., ex-Gorgoroth–or concurrent with or after this band. This last piece of information is important because it allowed me to make directed graphs, that is graphs with arrows that denote direction (read more here).
Diagrams
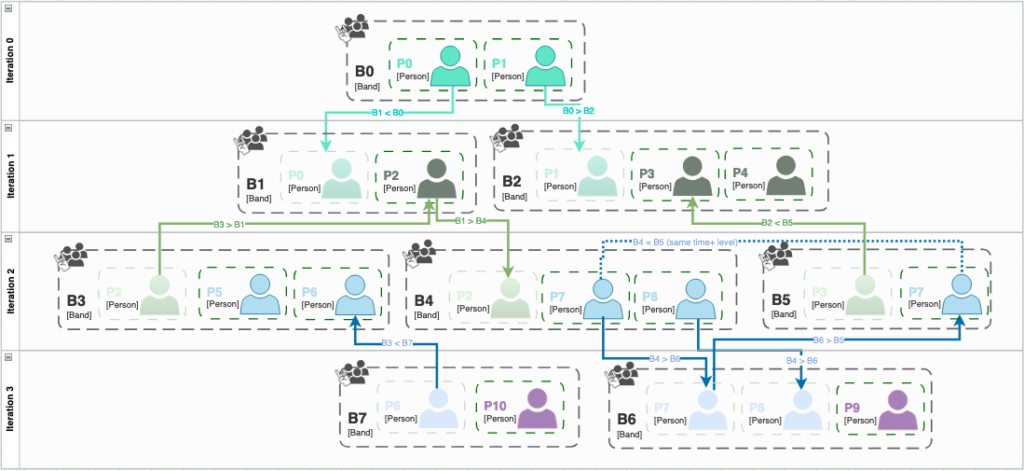
The diagram below shows an example of how the traversal worked. Members are enclosed within bands, and associated bands are linked by their respective members, the arrows showing the direction (chronologically) of movement. This is a fairly simple example as most bands usually have more members, thus more bands.
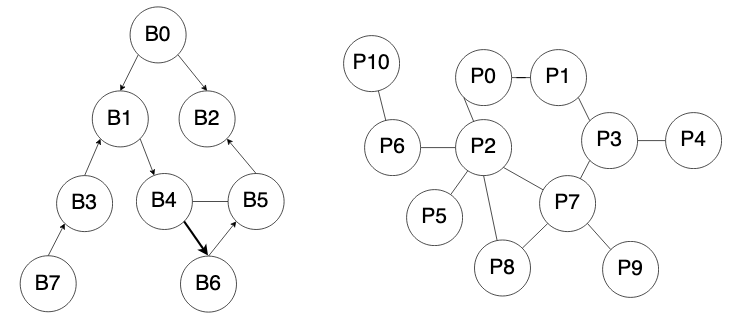
The below are different ways of representing the above as graphs. The one on the left is a generic example of the final output graph. On the left, note the arrows showing directions between the bands as well as the line weight. If multiple people travel from one band to another in the same direction, that increases the weight of the edge. The graph on the right is just a graph of relations between people based on the bands they were in.
Implementation & Output
I implemented a Python script (with Selenium) to crawl bands and associated bands (using a first in, first out approach), stopping at 3 iterations, writing output to a set of .json/.csv files and/or mysql tables. As I didn’t have a goal of doing any ad hoc traversal or querying, the implementation isn’t too fancy. And as this was intended to be a POC/limited project just for fun, I also opted against using Redis and the like, storing files locally should I have to grab the same page again.
I used Gephi initially to explore the data, and eventually moved to D3 (old version) for rendering the graphs in an .html page. Here are some pages for In Flames and Necrophobic.
Screenshots
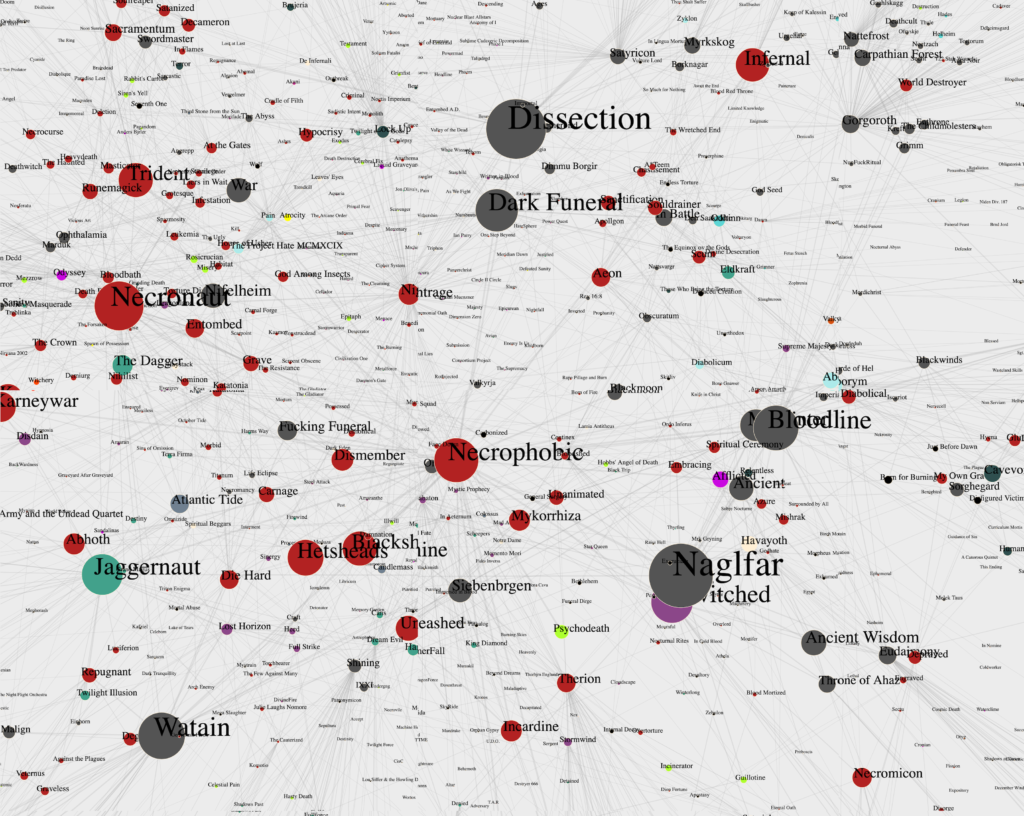
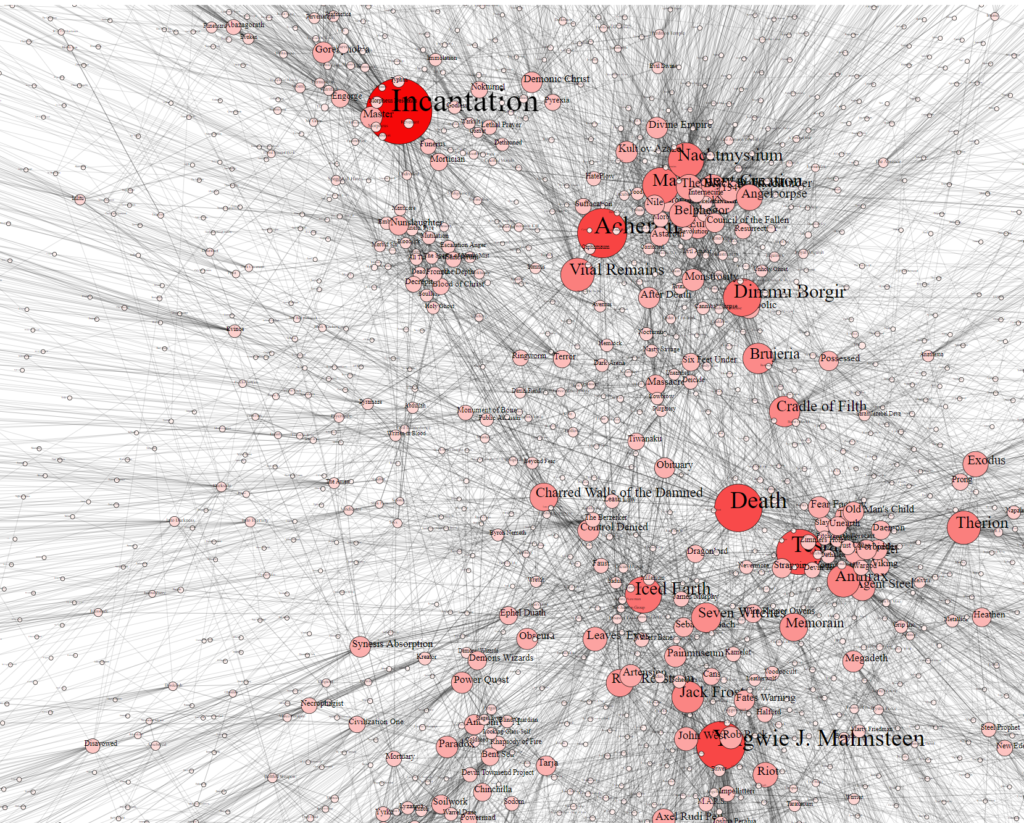
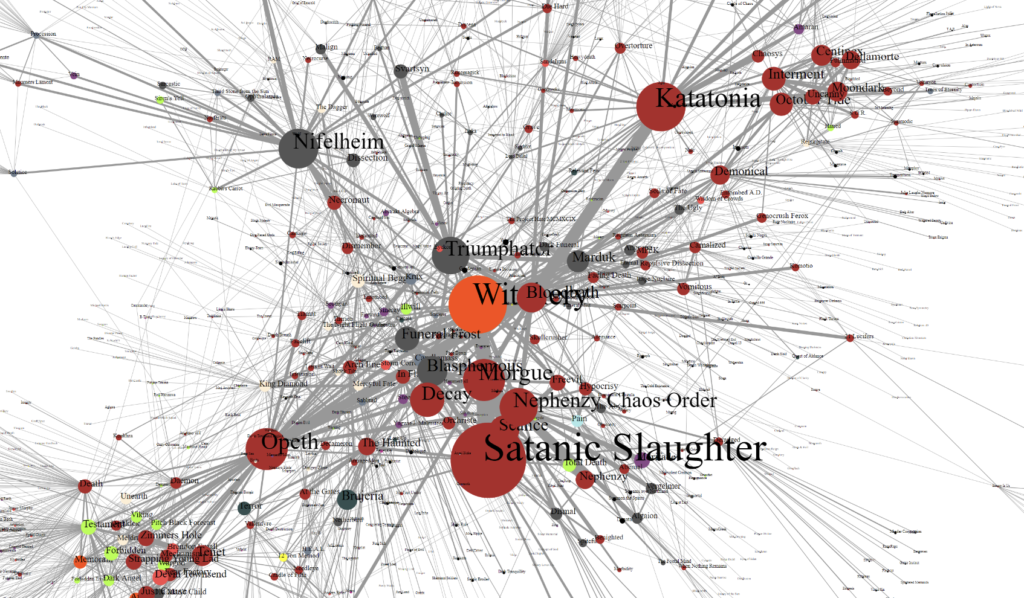
These are screenshots of Death network maps/graphs. The various colors represent different genres.
Future Work?
Aside from migrating the code to a different repo and refactoring, I’ve also explored different, more up-to-date libraries, like Plotly (and Dash), and want to use networkx a bit more for data management and dynamic queries.
However, this is a project I started many years ago that I eventually got around to reviving temporarily, so I may be ready to move onto finishing one of my many other projects first before committing this code to a publicly available repo as I judge my own code harshly and worry about security, AI, and all the other things out there.
Other Related Stuff for Fun
For an extensive (metal) genre map, check out Every Noise at Once.
For an interesting look into the source, see the genre examples here.
At some point I may dig up the pictures I got of my metal-themed alphabet fridge magnets using letters from various metal band logos. I ended up with a couple sets because there were so many options for the letters D, M, G, etc.